Tag: living standards
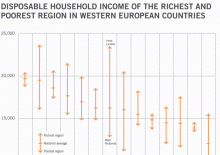
Briefing 61: Regional inequality in the UK is the worst in Western Europe
26 June 2015 • The gap between the richest and poorest region in the UK, in terms of disposable income, is the widest in the EU
Briefing 58: The richest get richer, the poorest get poorer
15 May 2015 • When taking inflation and spending habits into account alongside incomes, standards of living have declined for the poor but improved for the rich
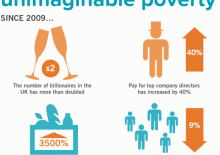
Briefing 55: Great wealth exists in the UK alongside unimaginable poverty
20 March 2015 • Since 2009 executive pay has soared and the number of billionaires has increased, while food bank use has rocketed and pay for ordinary workers has fallen
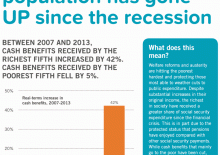
Briefing 54: The value of cash benefits paid to the rich has gone UP since the recession
6 March 2015 • Between 2007 and 2013, cash benefits paid to the richest fifth of the population increased by 42%. For the poorest fifth, benefits fell by 5%
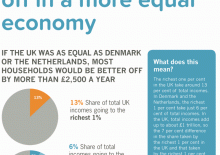
Briefing 45: Households would be better off in a more equal economy
19 September 2014 • Reducing the share of total UK income going to the richest 1% to Dutch or Danish levels & sharing the difference across the rest of the population would be worth an extra £2,500 a year to every household
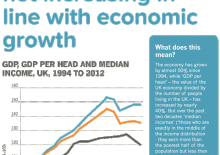
Briefing 44: Ordinary people are not getting a fair share of the proceeds of economic growth
5 September 2014 • While the economy has grown by 50% over the last 20 years, pay for those in the middle has only gone up by 20%
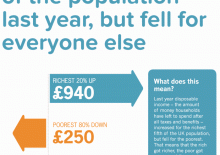
Briefing 42: Incomes increased for the richest last year, but fell for everyone else
8 August 2014 • The richest fifth of the UK population saw their incomes increase by £940 in 2013. But incomes were down by £250 for the other 80% of the population... and by £381 for the poorest fifth
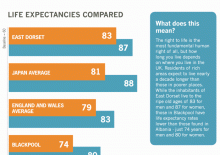
Briefing 37: People in poor areas die younger
4 July 2014 • Life expectancy in rich areas is nearly a decade longer than in the poorest parts of the UK
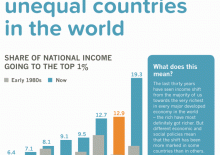
Briefing 36: The UK has become one of the most unequal countries in the world
27 June 2014 • Share of total income going to the richest 1% has grown faster in the UK than in most other advanced economies
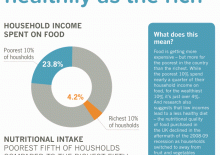
Briefing 35: The Poor cannot afford to eat as healthily as the rich
20 June 2014 • Poor people spend a much higher proportion of their income on food than richer households, yet still struggle to afford a healthy diet
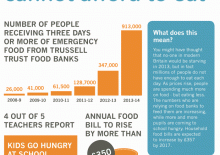
Briefing 34: People in the UK cannot afford to eat
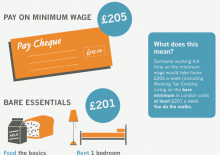
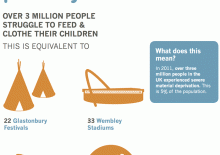
13 June 2014 • Though the UK's total wealth is amongst the highest in the world, many people across the country cannot afford to eat
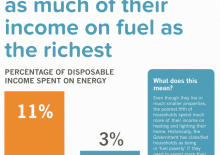
Briefing 33: Poor households spend more of their income on fuel than the richest
4 June 2014 • The poorest 20% spend an average 11% of household income on energy. The richest 20% spend just 3%
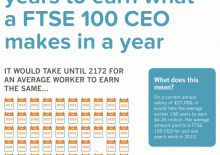
Briefing 28: It would take the average worker 158 years to earn what a FTSE 100 CEO makes in a year
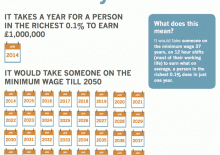
25 April 2014 • Based on a UK average salary of £27,000, most people would have to work until the year 2172 to earn what a typical FTSE100 CEO makes in a year
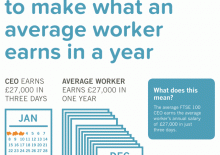
Briefing 27: A CEO earns the UK average salary in just three days
17 April 2014 • It takes a FTSE 100 CEO just three days to earn the average UK workers' annual salary of £27,000
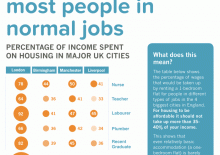
Briefing 23: Housing is unaffordable for most people in normal jobs
20 March 2014 • The housing costs for a rented one-bedroom flat in England's four biggest cities are now more than many skilled workers can afford
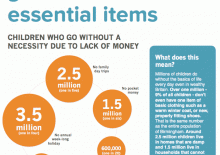
Briefing 21: millions of children go without essential items
7 March 2014 • Research shows that children have to cope without everyday items that most people would consider basic necessities
Don’t miss out – subscribe to our FREE weekly briefing.
Recent briefings
- Briefing 65: Privately educated children earn more than state-educated children with the same grades
- Briefing 64: There are more disadvantaged children in Britain than in many other advanced economies
- Briefing 63: Reducing inequality doesn’t harm the economy
- Briefing 62: Rising inequality has reduced the UK’s economic growth
- Briefing 61: Regional inequality in the UK is the worst in Western Europe

