Briefing • 15 May 2015
Briefing 58: The richest get richer, the poorest get poorer
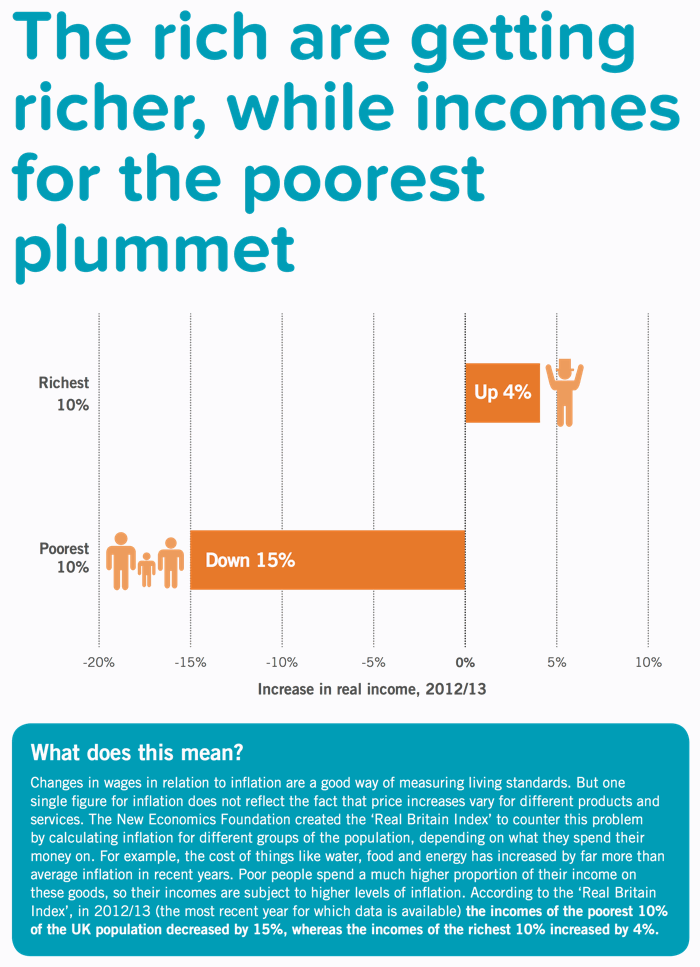
When taking inflation and spending habits into account alongside incomes, standards of living have declined for the poor but improved for the rich
To download the pdf, click here
Explaining the data
Explaining the data: These figures were calculated by the New Economics Foundation (NEF) as part of their ‘Real Britain Index’ - http://www.realbritainindex.org/. NEF calculated a more detailed inflation figure for each decile (group of 10%) of the UK population from richest to poorest, based on their spending habits (for example, the poorest decile spend a higher proportion of their income on food, so are hit harder by food price increases, but are less likely to be affected by changes in the cost of luxury goods). NEF then used these inflation figures to calculate the year-on-year change in the incomes of each decile. Since the data used in this infographic was published, inflation has fallen, giving hope that real incomes of poorer households will rise. But this will also depend on factors such as low pay and cuts to social security.
Tagged under: income inequality, living standards, poverty, rising inequality
Don’t miss out – subscribe to our FREE weekly briefing.
Recent briefings
- Briefing 65: Privately educated children earn more than state-educated children with the same grades
- Briefing 64: There are more disadvantaged children in Britain than in many other advanced economies
- Briefing 63: Reducing inequality doesn’t harm the economy
- Briefing 62: Rising inequality has reduced the UK’s economic growth
- Briefing 61: Regional inequality in the UK is the worst in Western Europe


