Briefing • 6 March 2015
Briefing 54: The value of cash benefits paid to the rich has gone UP since the recession
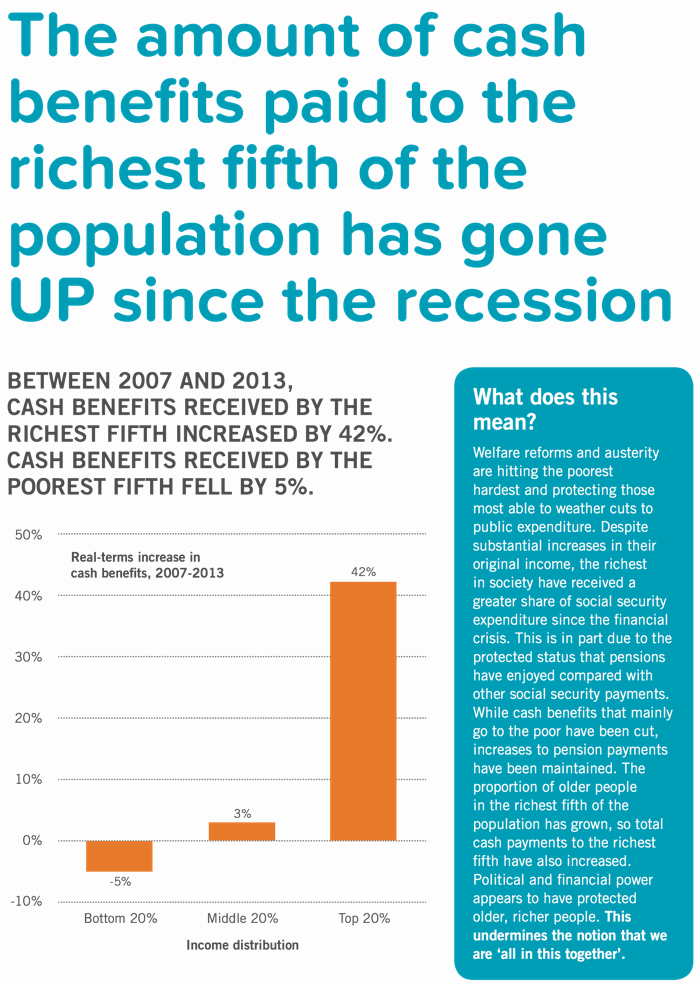
Between 2007 and 2013, cash benefits paid to the richest fifth of the population increased by 42%. For the poorest fifth, benefits fell by 5%
To download the full pdf, click here
Explaining the data
Here we have relied on a dataset produced by the Office for National Statistics. This data tracks the effects of taxes and benefits on household income over time. The series runs from 1977 to 2013 and is available here (table 14a). These figures are produced based on the average amount of cash benefits, original income and gross income received by households across the income distribution. We have rounded figures to the nearest whole number for clarity, but for accuracy the bottom, middle and top income quintiles of the income distribution saw an average real-term change in their receipt of cash benefits by 4.6%, 3.3% and 41.6% respectively. Calculations are based on RPI deflation
Tagged under: income inequality, inter-generational inequality, living standards, rising inequality
Don’t miss out – subscribe to our FREE weekly briefing.
Recent briefings
- Briefing 65: Privately educated children earn more than state-educated children with the same grades
- Briefing 64: There are more disadvantaged children in Britain than in many other advanced economies
- Briefing 63: Reducing inequality doesn’t harm the economy
- Briefing 62: Rising inequality has reduced the UK’s economic growth
- Briefing 61: Regional inequality in the UK is the worst in Western Europe


