Briefing • 15 November 2013
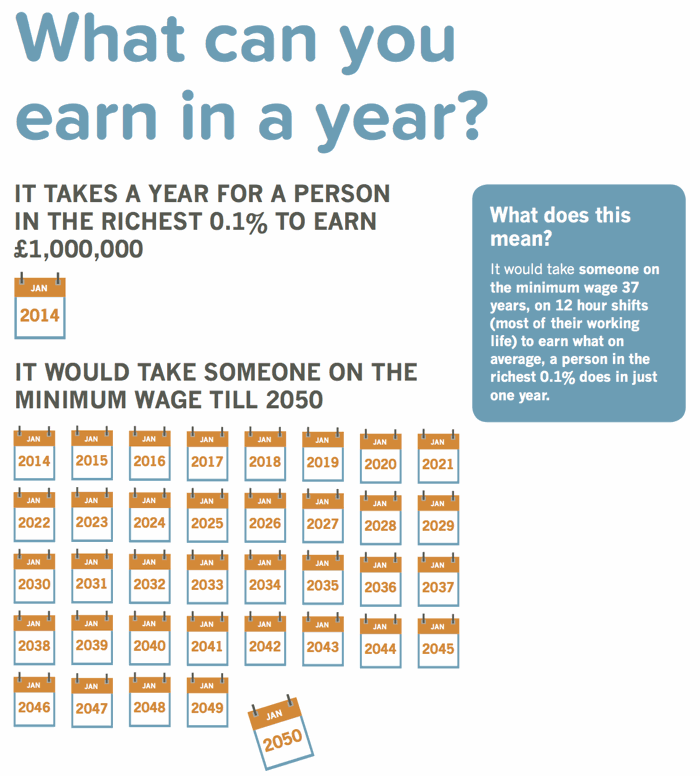
Briefing 6 : What can you earn in a year?
Download the full pdf here.
Explaining the data
Here we have relied upon data produced for the World Incomes Database at the Paris School of Economics. It is all available online http://topincomes.g-mond.parisschoolofeconomics.eu. This data relates to 2009 as it is the most up-to-date data available. The average total gross income for a person in the top 0.1% was £1,000,970. We then compare it to the minimum wage for 2013. While there is obviously a discrepancy in using figures from 2009 and 2013 there is no evidence that pay at the top has fallen substantially so we felt it was not inappropriate to do this. For reference in 2009 the minimum wage was £5.73 per hour (58p less than today).
Tagged under: income inequality, living standards, poverty
Don’t miss out – subscribe to our FREE weekly briefing.
Recent briefings
- Briefing 65: Privately educated children earn more than state-educated children with the same grades
- Briefing 64: There are more disadvantaged children in Britain than in many other advanced economies
- Briefing 63: Reducing inequality doesn’t harm the economy
- Briefing 62: Rising inequality has reduced the UK’s economic growth
- Briefing 61: Regional inequality in the UK is the worst in Western Europe


