Tag: international comparisons
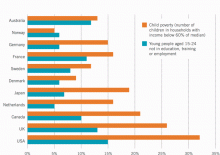
Briefing 64: There are more disadvantaged children in Britain than in many other advanced economies
16 October 2015 • A higher proportion of UK children grow up in households with incomes well below the national median, while more young people in the UK are not in education, employment or training
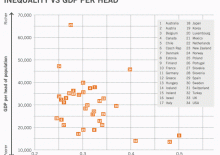
Briefing 63: Reducing inequality doesn’t harm the economy
24 July 2015 • Higher inequality does not make countries richer
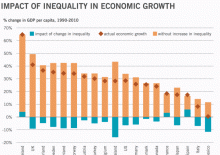
Briefing 62: Rising inequality has reduced the UK’s economic growth
10 July 2015 • Analysis from the OECD think-tank found that extreme inequality is bad for growth
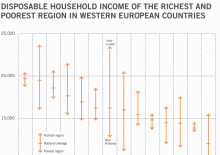
Briefing 61: Regional inequality in the UK is the worst in Western Europe
26 June 2015 • The gap between the richest and poorest region in the UK, in terms of disposable income, is the widest in the EU
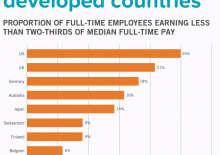
Briefing 59: There are more low-paid workers in the UK than in other advanced economies
29 May 2015 • A higher percentage of workers earn less than two thirds of median full-time pay in the UK than in most other developed countries
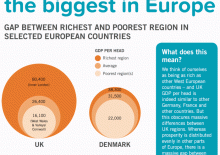
Briefing 56: the gap between the richest and poorest region in the UK is the biggest in Europe
10 April 2015 • The gap in GDP-per-head between inner London and West Wales and the Valleys or Cornwall is bigger than the gap between the richest and poorest region in any other EU country
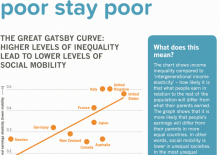
Briefing 50: In the UK, the rich stay rich and the poor stay poor
28 November 2014 • Equal opportunities depend on more equal outcomes - the UK is more unequal than other countries, meaning fewer people who are born poor become rich
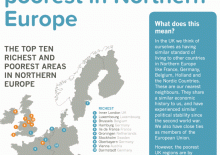
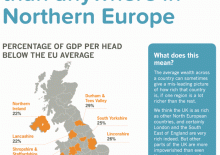
Briefing 47: The poorest regions in the UK are the poorest in Northern Europe
16 October 2014 • Many UK regions are at least 20% poorer than the EU average, way below the poorest parts of France, Germany and other countries
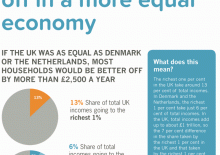
Briefing 45: Households would be better off in a more equal economy
19 September 2014 • Reducing the share of total UK income going to the richest 1% to Dutch or Danish levels & sharing the difference across the rest of the population would be worth an extra £2,500 a year to every household
Briefing 43: The poorest regions of the UK are the poorest in North West Europe
22 August 2014 • GDP per head in the poorest UK regions is lower than any region of France, Germany, Belgium, Holland, Luxembourg, Austria, Ireland, Sweden, Finland or Denmark
Briefing 43: The poorest regions of the UK are the poorest in North-West Europe
15 August 2014 • Eight UK regions are poorer than anywhere in France, Germany, Holland, Belgium, Luxembourg, Austria, Denmark, Finland, Sweden or Ireland
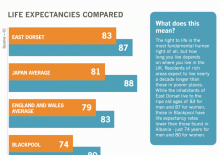
Briefing 37: People in poor areas die younger
4 July 2014 • Life expectancy in rich areas is nearly a decade longer than in the poorest parts of the UK
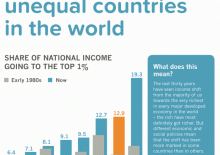
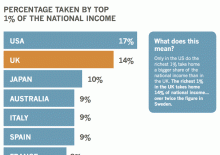
Briefing 36: The UK has become one of the most unequal countries in the world
27 June 2014 • Share of total income going to the richest 1% has grown faster in the UK than in most other advanced economies
Don’t miss out – subscribe to our FREE weekly briefing.
Recent briefings
- Briefing 65: Privately educated children earn more than state-educated children with the same grades
- Briefing 64: There are more disadvantaged children in Britain than in many other advanced economies
- Briefing 63: Reducing inequality doesn’t harm the economy
- Briefing 62: Rising inequality has reduced the UK’s economic growth
- Briefing 61: Regional inequality in the UK is the worst in Western Europe

