Briefing • 26 June 2015
Briefing 61: Regional inequality in the UK is the worst in Western Europe
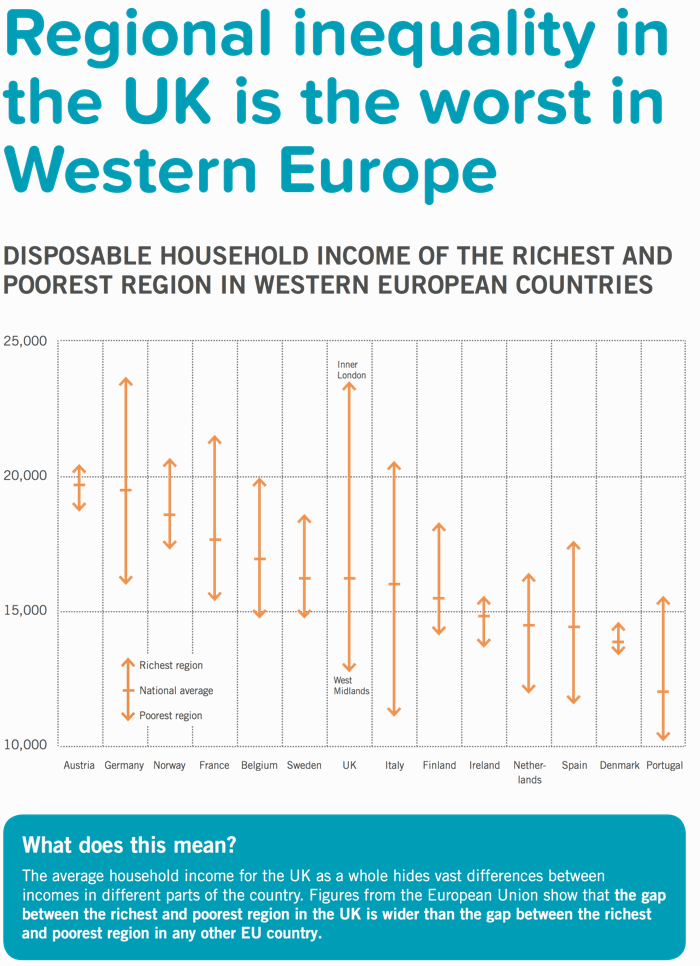
The gap between the richest and poorest region in the UK, in terms of disposable income, is the widest in the EU
To download the full pdf, click here
Explaining the data
Previous infographics on regional inequality have shown the difference in regional GDP per head (the value of goods and services produced in an area, per person). This shows 'disposable income', the amount of money each household has to spend. The results are the same - the gap between the richest and poorest region in the UK is wider than in any other country. Keep in mind too, that the very high incomes of some households in London give a very high average that obscures the considerable poverty in that city.
These figures are taken from data compiled by Eurostat, the data agency of the European Union. The currency used by Eurostat is the ‘Purchasing Power Standard’, an economic measurement that accounts for differences in the value of different currencies, as well as the different costs in different areas. You can find the full data set at http://appsso.eurostat.ec.europa.eu/nui/show.do?dataset=nama_r_ehh2inc&lang=en
Tagged under: income inequality, international comparisons, living standards, regional inequality
Don’t miss out – subscribe to our FREE weekly briefing.
Recent briefings
- Briefing 65: Privately educated children earn more than state-educated children with the same grades
- Briefing 64: There are more disadvantaged children in Britain than in many other advanced economies
- Briefing 63: Reducing inequality doesn’t harm the economy
- Briefing 62: Rising inequality has reduced the UK’s economic growth
- Briefing 61: Regional inequality in the UK is the worst in Western Europe


