Briefing • 14 November 2014
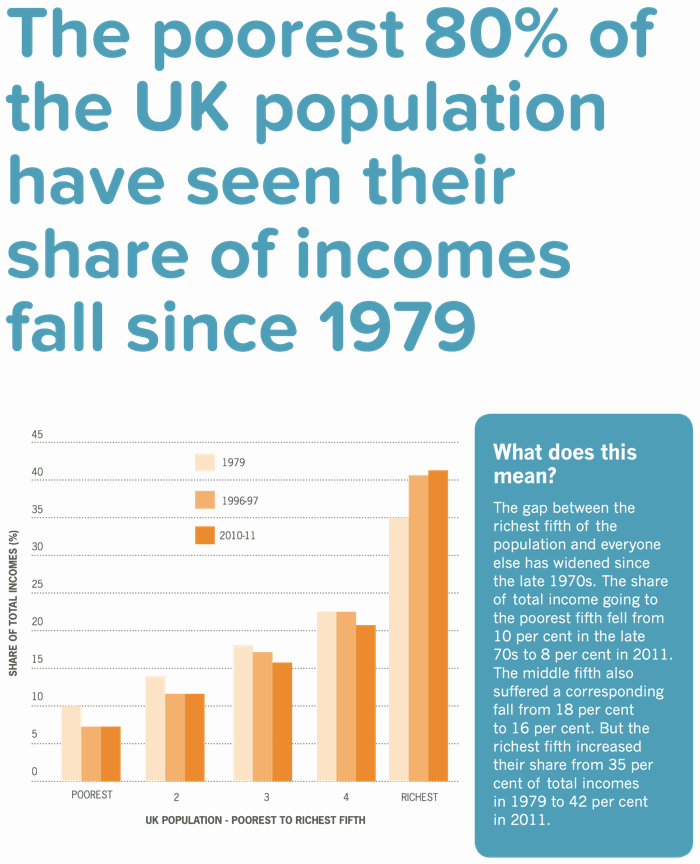
Briefing 49: The poorest 80% of the UK population have seen their share of incomes fall since 1979
The richest are steadily pulling away from everybody else

To download the full pdf, click here
Explaining the data
This chart is taken from Professor John Hills’s book 'Good Times, Bad Times: the welfare myth of them and us' published by ‘Policy Press’ in November 2014 The figures are taken from earlier analyses by Jenkins SP and Cowell F 'Dwarfs and Giants in the 1980s: Trends in UK income distribution' (1993) and Adams N, Carr J, Collins J, Johnson G and Matejic P, Households Below Average Income: An analysis of the income distribution, 1994/95 to 2010/11(2012).
Tagged under: income inequality, rising inequality
Don’t miss out – subscribe to our FREE weekly briefing.
Recent briefings
- Briefing 65: Privately educated children earn more than state-educated children with the same grades
- Briefing 64: There are more disadvantaged children in Britain than in many other advanced economies
- Briefing 63: Reducing inequality doesn’t harm the economy
- Briefing 62: Rising inequality has reduced the UK’s economic growth
- Briefing 61: Regional inequality in the UK is the worst in Western Europe


