Briefing • 25 October 2013
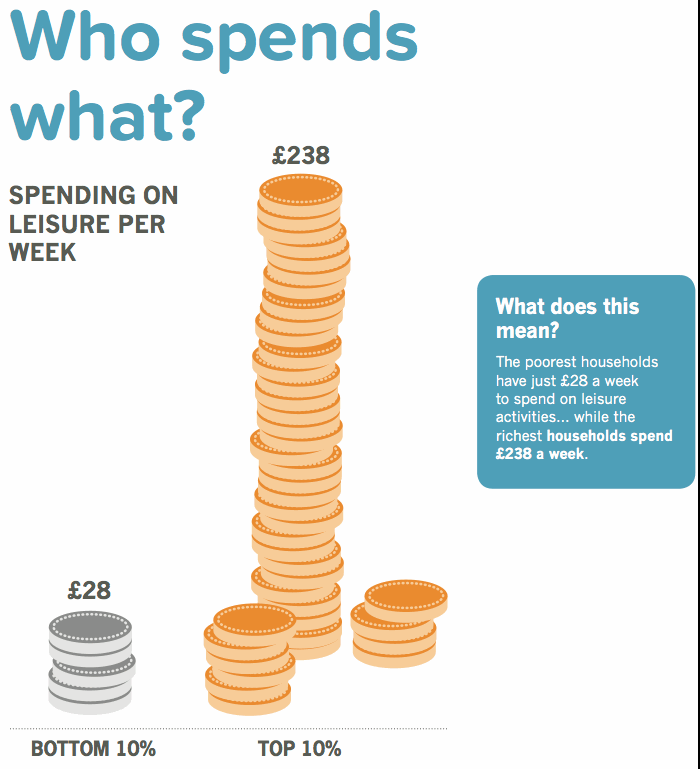
Briefing 3: Who Spends What?

Download the full pdf here.
Explaining the data
Here we have used data from the Office of National Statistics. This is produced annually and the latest data relates to 2011. It is worth noting that on average there are more persons per household in the top 10% of households than in the bottom 10% of households. If you were looking at average spend per person someone in the bottom 10% will spend £134.80 per week while someone in the top 10% will spend £321.20. It is also worth saying that this data on spending does not include information on what those and the top and bottom are investing for the future.
Tagged under: income inequality, living standards
Don’t miss out – subscribe to our FREE weekly briefing.
Recent briefings
- Briefing 65: Privately educated children earn more than state-educated children with the same grades
- Briefing 64: There are more disadvantaged children in Britain than in many other advanced economies
- Briefing 63: Reducing inequality doesn’t harm the economy
- Briefing 62: Rising inequality has reduced the UK’s economic growth
- Briefing 61: Regional inequality in the UK is the worst in Western Europe


